What do we do when we have to show a large data set in a presentation?
The first step may be to recognize that the presenter has the responsibility to lead his audience through the maze of numbers on the screen (hopefully not with that highly-irritating laser pointer). As speakers, we have to make the numbers meaningful.
The next step may be to understand that only so much information can be disseminated in a presentation — the details are often best left to a printed report or handout.
So how do we help our audience make sense out of the numbers we do show? There are at least 4 answers — maybe more by the time I finish this series.
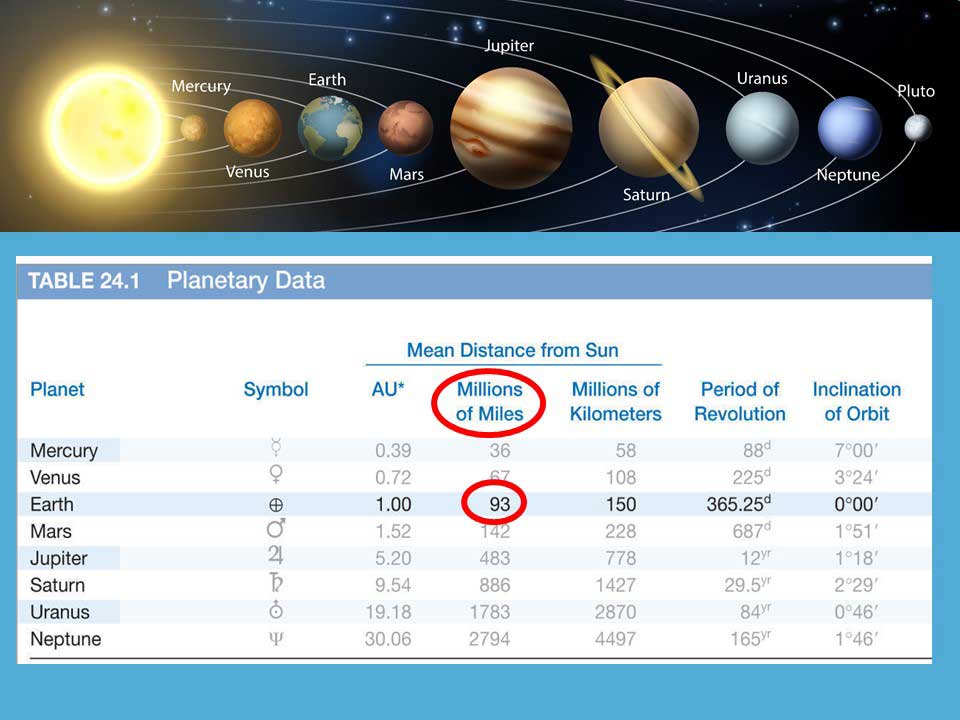
The simplest solution is to show the original complex table and then block out the unnecessary detail we don’t want to discuss and/or highlight the critical numbers we do want to discuss.
The slide above uses semitransparent white boxes to minimize the unimportant content and red circles to draw attention to what is important.
The advantage here is that we are showing the entire data set in its original table format. A disadvantage could be that the type size in the original table may be a little too small to be very legible. But at least we are helping the audience make sense out of a sea of information.
Next week: A few rules for using graphs.